General Aptitude (GA)
Q.1 – Q.5 Multiple Choice Question (MCQ), carry ONE mark each (for each wrong answer: – 1/3).
| Q.1 | The people were at the demonstration were from all sections of society. |
| (A) | whose |
| (B) | which |
| (C) | who |
| (D) | whom |
Q.2 | A transparent square sheet shown above is folded along the dotted line. The folded sheet will look like . 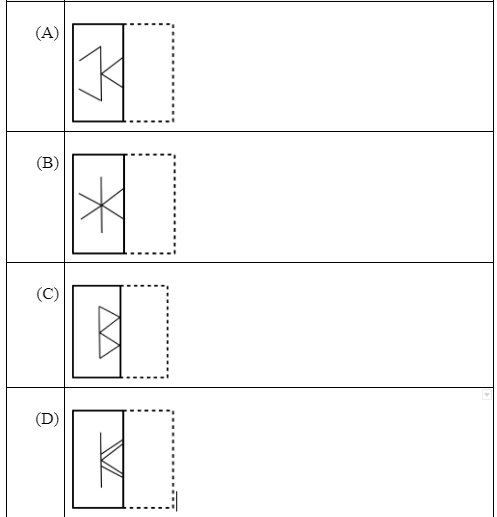 |
Q.3 | For a regular polygon having 10 sides, the interior angle between the sides of the polygon, in degrees, is: |
(A) | 396 |
(B) | 324 |
(C) | 216 |
(D) | 144 |
Q.4 | Which one of the following numbers is exactly divisible by (1113+1)? |
(A) | 1126+1 |
(B) | 1133+1 |
(C) | 1139+1 |
(D) | 1152+1 |
Q.5 | Oasis is to sand as island is to___________ Which one of the following options maintains a similar logical relation in the above sentence? |
| (A) | Stone |
| (B) | Land |
| (C) | Water |
| (D) | Mountain |
- 6 – Q. 10 Multiple Choice Question (MCQ), carry TWO marks each (for each wrong answer: – 2/3).
Q.6 | The importance of sleep is often overlooked by students when they are preparing for exams. Research has consistently shown that sleep deprivation greatly reduces the ability to recall the material learnt. Hence, cutting down on sleep to study longer hours can be counterproductive.Which one of the following statements is the CORRECT inference from the above passage? |
(A) | Sleeping well alone is enough to prepare for an exam. Studying has lesser benefit. |
| (B) | Students are efficient and are not wrong in thinking that sleep is a waste of time. |
| (C) | If a student is extremely well prepared for an exam, he needs little or no sleep. |
| (D) | To do well in an exam, adequate sleep must be part of the preparation. |
Q.7 | 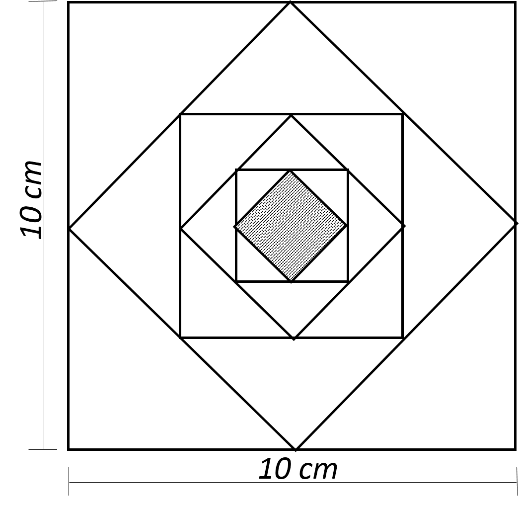 In the figure shown above, each inside square is formed by joining the midpoints of the sides of the next larger square. The area of the smallest square (shaded) as shown, in cm2 is: |
(A) | 12.50 |
(B) | 6.25 |
(C) | 3.125 |
(D) | 1.5625 |
Q.8 | Let X be a continuous random variable denoting the temperature measured. The range of temperature is [0, 100] degree Celsius and let the probability density function of X be f(x) = 0.01 for 0 ≤ X ≤ 100. The mean of X is ____________ |
(A) | 2.5 |
(B) | 5.0 |
(C) | 25.0 |
(D) | 50.0 |
Q.9 | 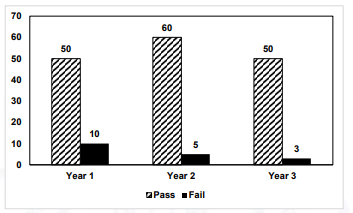 The number of students passing or failing in an exam for a particular subject are presented in the bar chart above. Students who pass the exam cannot appear for the exam again. Students who fail the exam in the first attempt must appear for the exam in the following year. Students always pass the exam in their second attempt.The number of students who took the exam for the first time in the year 2 and the year 3 respectively, are . The number of students passing or failing in an exam for a particular subject are presented in the bar chart above. Students who pass the exam cannot appear for the exam again. Students who fail the exam in the first attempt must appear for the exam in the following year. Students always pass the exam in their second attempt.The number of students who took the exam for the first time in the year 2 and the year 3 respectively, are . |
A) | 65 and 53 |
(B) | 60 and 50 |
(C) | 55 and 53 |
(D) | 55 and 48 |
Q.10 | Seven cars P, Q, R, S, T, U and V are parked in a row not necessarily in that order. The cars T and U should be parked next to each other. The cars S and V also should be parked next to each other, whereas P and Q cannot be parked next to each other. Q and S must be parked next to each other. R is parked to the immediate right of V. T is parked to the left of U.Based on the above statements, the only INCORRECT option given below is: |
(A) | There are two cars parked in between Q and V. |
(B) | Q and R are not parked together. |
(C) | V is the only car parked in between S and R. |
(D) | Car P is parked at the extreme end. |
Ecology and Evolution (EY)
- – Q.16 Multiple Choice Question (MCQ), carry ONE mark each (for each wrong answer: – 1/3).
Q.1 | Animal species can vary in whether dispersal is more likely among male offspring (male-biased), female offspring (female-biased), or similar between the sexes. Dispersal in birds and mammals is most commonly |
| (A) | female-biased and male-biased, respectively. |
| (B) | female-biased and similar between the sexes, respectively. |
| (C) | male-biased and female-biased, respectively. |
| (D) | similar between the sexes, and female-biased respectively. |
| Q.2 | Of the following, which one is the most direct measure of Darwinian fitness? |
| (A) | Adult body size |
| (B) | Lifetime reproductive success |
| (C) | Lifespan |
| (D) | Maximum sprint speed |
| Q.3 | The marginal value theorem in optimal foraging theory examines which one of the following foraging decisions? |
| (A) | How long to stay in a patch of food |
| (B) | How to allocate time to foraging versus reproduction |
| (C) | How to minimise risk while foraging |
| (D) | How to select between different food types within a patch |
| Q.4 | Which one of the following shows the highest degree of endemism? |
| (A) | Birds of the Himalayas |
| (B) | Mammals of central India |
| (C) | Frogs of the Western Ghats |
| (D) | Trees of the Gangetic basin |
| Q.5 | Which one of the following Mendelian disorders is influenced by diet? |
| (A) | Cystic fibrosis |
| (B) | Haemophilia |
| (C) | Phenylketonuria |
| (D) | Thalassemia |
| Q.6 | Which one of the following mammalian DNA regions exhibits the highest level of sequence variation? |
| (A) | Homeobox transcription factor binding domain |
| (B) | Hox genes |
| (C) | Mitochondrial D-loop region |
| (D) | Histone protein-encoding genes |
| Q.7 | Which one of the following makes a species most vulnerable to extinction? |
| (A) | Low density throughout a large geographic range and in several habitat types |
| (B) | Locally common in a restricted geographic range and in several habitat types |
| (C) | Low density throughout a large geographic range and in a specific habitat type |
| (D) | Locally common in a restricted geographic range and in a specific habitat type |
| Q.8 | The frequency distributions of a trait in two populations, X and Y, are shown in the figure.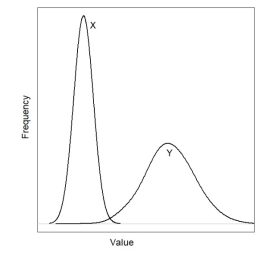 Which one of the following statements about the mean and standard deviation (SD) of the two populations is accurate? Which one of the following statements about the mean and standard deviation (SD) of the two populations is accurate? |
| (A) | X has higher mean, and Y has higher SD. |
| (B) | Y has higher mean, and X has higher SD. |
| (C) | X has higher mean, and X has higher SD. |
| (D) | Y has higher mean, and Y has higher SD. |
| Q.9 | Two sister species of bulbuls have non-overlapping distributions. One is distributed in India and the other in Sri Lanka. Which one of the following modes of speciation is the most parsimonious explanation for this pattern? |
| (A) | Allopatric speciation |
| (B) | Sympatric speciation |
| (C) | Parapatric speciation |
| (D) | Peripatric speciation |
| Q.10 | In an Arctic Ocean food chain, killer whales feed on sea otters, which feed on sea urchins, which in turn feed on kelp (a type of seaweed). An increase in the abundance of killer whales causes sea otter abundance to decline, leading to higher sea urchin densities, which in turn reduces the abundance of kelp. Which one of the following terms describes this phenomenon? |
| (A) | Trophic cascade |
| (B) | Prey switching |
| (C) | Competitive exclusion |
| (D) | Productivity-stability relationship |
| Q.11 | Listed below are hypotheses for the evolution of monogamy. Which one of these is NOT based on the concept of individual selection? |
| (A) | Food provisioning by both parents is crucial for offspring survival. |
| (B) | Biparental protection from predators is essential for offspring survival. |
| (C) | Females are solitary and dispersed, therefore, males cannot effectively mate- guard more than one female at a time. |
| (D) | Forming monogamous pairs allows individuals to regulate their reproductive output and ensure the survival of the species. |
Q.12 | Rising temperature due to global warming can stimulate decomposition of organic matter and release CO2 into the atmosphere. This is an example of |
(A) | positive feedback. |
(B) | negative feedback. |
(C) | environmental heterogeneity. |
(D) | environmental stochasticity. |
Q.13 | Ant-mimic spiders of the genus Myrmarachne are known for which one of the following evolutionary phenomena? |
(A) | Aposematism |
(B) | Aggressive mimicry |
(C) | Batesian mimicry |
(D) | Muellerian mimicry |
Q.14 | The probability of local extinction increases with body size when there is forest degradation, loss, and fragmentation. Consider the following hypotheses for the vulnerability of larger-bodied species:Larger-bodied species tend to have smaller population sizes.Larger-bodied species require larger territories/home ranges.Larger-bodied species have higher absolute resource and energy requirements.Which one of the following options correctly lists all potential reasons for the vulnerability of larger-bodied species? |
(A) | P and Q only |
(B) | P only |
(C) | P and R only |
(D) | P, Q, and R |
Q.15 | Grazing by large mammalian herbivores can have a strong influence on ecosystem structure, and can cause ecosystems to transition between alternative states over decades. Which one of the following transitions can result from grazing? |
(A) | Mangrove to coral reef |
(B) | Terai grassland to alpine meadow |
(C) | Savanna to grassland |
(D) | Tropical rainforest to arid desert |
Q.16 | The effective population size of a sexually reproducing, diploid, animal species will be highest when the sex ratio (number of reproducing males / number of reproducing females) is |
(A) | 1 |
(B) | 0.5 |
(C) | 1.5 |
(D) | 2 |
Q. 17 – Q. 22 Multiple Select Question (MSQ), carry ONE mark each (no negative marks).
Q.17 | The theory of evolution by natural selection was proposed by which one (or more) of the following? |
(A) | Charles Darwin |
(B) | Jean Baptiste Lamarck |
(C) | Alfred Russel Wallace |
(D) | Georges Cuvier |
| Q.18 | According to the MacArthur – Wilson equilibrium model of island biogeography, which one (or more) of the following factors affect(s) extinction rate on an island? |
| (A) | Interspecific competition |
| (B) | Island area |
| (C) | Intraguild predation |
| (D) | Species identity |
Q.19 | Which of the following is/are necessary condition(s) for natural selection to shape limb lengths in a population? |
(A) | Individuals in a population vary in the length of their limbs. |
(B) | Limb length increases in individuals with repeated use. |
(C) | Offspring inherit the limb lengths of their parents. |
(D) | Limb length influences running speed and thus, their ability to survive and reproduce. |
Q.20 | Which of the following is/are possible reason(s) for linkage disequilibrium between alleles at two loci? |
(A) | Low recombination rate between loci |
(B) | High recombination rate between loci |
(C) | Natural selection |
(D) | Polyploidy |
| Q.21 | Metabolism includes the processes of catabolism and anabolism. Select the anabolic process(es). |
| (A) | Growth |
| (B) | Storage |
| (C) | Respiration |
| (D) | Excretion |
Q.22 | SARS-CoV-2 is hypothesised to have jumped from bats to pangolins before infecting humans. Which one (or more) of the following methods can be effectively used for testing this hypothesis? |
(A) | Comparative genomics |
(B) | DNA fingerprinting |
(C) | Phylogenetics |
(D) | Transgenesis |
Q. 23 – Q. 25 Numerical Answer Type (NAT), carry ONE mark each (no negative marks).
Q.23 | A sample of heights of trees follows a normal distribution. In this sample, 68% of height measurements are expected to fall in the interval:mean ± standard deviation. (Round off to the nearest integer.) |
Q.24 | A bird species has an annual survival probability of 0.30. While sampling the population of this species, the probability that any individual is captured in a given year is 0.40. A bird is captured, tagged and released in Year one. The probability that it is re-captured in Year two is _________. (Round off to two decimal places.) |
Q.25 | Sex ratio at birth is biased towards females in a mongoose population. If the probability of having a daughter is 0.7 in this population, and if sex determination of each offspring is an independent event, then the probability that a female with a litter of four offspring has at least one son is____ . (Round off to two decimal places.) |
Q.26 – Q.46 Multiple Choice Question (MCQ), carry TWO mark each (for each wrong answer: – 2/3).
Q.26 | In a species of gecko, males are polymorphic such that some males are yellow and other males are white. A student hypothesises that body colour is a signal of aggression. To test this, he measures aggression in yellow and white males. He also measures body size in every individual he tests. He plots the data in the following way (yellow males: solid line and filled dots; white males: dashed line and open dots). Which one of the following statements is correct based on these data?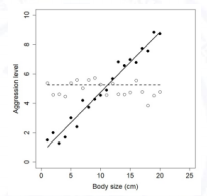 |
(A) | All yellow males are more aggressive than white males. |
(B) | Body size is correlated with aggression in all males. |
(C) | Body size correlates with aggression in yellow males only. |
(D) | Small yellow males are more aggressive than small white males. |
Q.27 | Homing pigeons can perceive the pattern of polarized light in the sky (which depends on the position of the sun relative to the earth). This enables homing pigeons to orient and navigate home if released in any location. One can reset their biological clock in captivity by artificially controlling the light conditions. If you acclimatize a pigeon to a new lighting cycle with “sunrise” at 6 PM and “sunset” at 6 AM, instead of 6 AM sunrise and 6 PM sunset that naturally occurs, the bird will be clock- shifted by 12 hours within a few days. Suppose you release two birds, a normal bird (N) and a 12-hr clock-adjusted bird (C), 30 km East of their home at 6 AM. In which direction will each bird fly? |
(A) | Both birds will fly West. |
(B) | Both birds will fly East. |
(C) | Bird N will fly West, bird C will fly East. |
(D) | Bird C will fly West, bird N will fly East. |
Q.28 | Demographic stochasticity introduces random variation in population growth because |
(A) | changing weather conditions from year-to-year can result in good and bad years for reproduction. |
(B) | the discrete nature of births and deaths introduces uncertainty in population parameters. |
(C) | per capita birth rate in a population decreases with an increase in population density. |
(D) | of predictable time lags between change in population size and reproduction. |
Q.29 | In an island chain, species richness (S) increases with island area (A) according to the equation, S=4.3A0.55.Which one of the following graphs best represents this equation?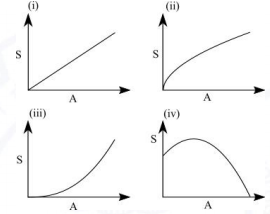 |
(A) | (i) |
(B) | (ii) |
(C) | (iii) |
(D) | (iv) |
Q.30 | A researcher measures the abundance of a tree species in 10 plots in each of two habitats. She tests for differences in abundance between the two habitats using an ANOVA. The results from the ANOVA are as follows:Mean abundance in habitat A = 30 treesMean abundance in habitat B = 50 treesF-statistic (on 1 and 18 degrees of freedom) = 6.04P-value = 0.02Here, a P-value of 0.02 means that |
(A) | repeating this study 100 times will provide a result of “no difference” in abundance between the two habitats with a probability of 0.02. |
| (B) | there is a 2% chance that abundances differ between habitats. |
| (C) | the probability that an F-statistic with a value of 6.04 or greater falls within the F-distribution for 1 and 18 degrees of freedom is 0.02. |
(D) | there is a very large difference in the abundance of the species between the two habitats because the P-value is less than 0.05. |
Q.31 | In the graph shown, the solid line represents the best fit from an ordinary least-squares regression, where X is the predictor variable and Y is the response variable. In this case, which one of the following assumptions of the linear regression is violated? |
(A) | Equal variances in Y across values of X |
(B) | Normal distribution of residuals |
(C) | Independence of data points |
(D) | Linear relationship between X and Y |
Q.32 | Consider the following list of bacteria and the infections they cause in humans.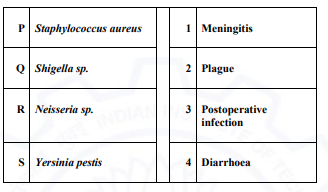 Which one of the following combinations correctly matches these micro-organisms and the infections they cause in humans? Which one of the following combinations correctly matches these micro-organisms and the infections they cause in humans? |
| (A) | P-2; Q-1; R-4; S-3 |
| (B) | P-2; Q-3; R-1; S-4 |
| (C) | P-3; Q-4; R-1; S-2 |
| (D) | P-3; Q-4; R-2; S-1 |
| Q.33 | Which one of the following statements is INCORRECT with respect to the tree of life? |
(A) | Ctenophora is more closely related to Cnidaria than it is to Echinodermata. |
(B) | Porifera is more closely related to Ctenophora than it is to Echinodermata. |
(C) | Arthropoda is more closely related to Tardigrada than it is to Annelida. |
(D) | Arthropoda is more closely related to Mollusca than it is to Nematoda. |
Q.34 | Consider a population that shows logistic growth of the form For such a population (N > 0), which one of the following graphs shows the correct relationship between per capita growth rate 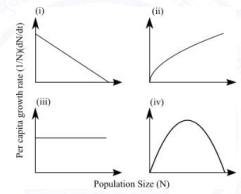 |
(A) | (i) |
(B) | (ii) |
(C) | (iii) |
(D) | (iv) |
Q.35 | Which one of the following represents the correct chronological order of geological periods (from oldest to most recent)? |
| (A) | Devonian Jurassic Cambrian Neogene |
| (B) | Devonian Cambrian Neogene Jurassic |
| (C) | Cambrian Devonian Jurassic Neogene |
| (D) | Cambrian Neogene Devonian Jurassic |
Q.36 | Soils undergo weathering over large time-scales (millions of years). Over time, concentration of phosphorus (P) declines monotonically (solid line), while nitrogen (N) shows a unimodal pattern (dotted line) as shown.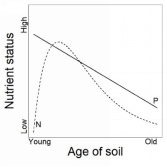 Based on this pattern, which one of the following diagrams represents the likely trend in N:P ratio? Based on this pattern, which one of the following diagrams represents the likely trend in N:P ratio?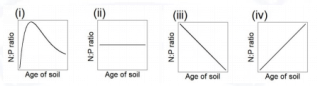 |
| (A) | (i) |
| (B) | (ii) |
| (C) | (iii) |
| (D) | (iv) |
Q.37 | A large forest area is fragmented into multiple smaller patches of different sizes. A researcher estimates the number of bird species in these forest fragments immediately following fragmentation, and then again 20 years later. The relationship between fragment size and species richness is shown in the graph for the two sampling events (immediately after fragmentation: closed circles and solid line; 20 years after fragmentation: open circles and dashed line). The best explanation for the differences in species richness with fragment size between the two sampling events is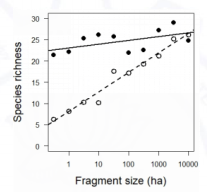 |
(A) | Allen’s rule. |
(B) | K-selection. |
(C) | extinction debt. |
(D) | Bergmann’s rule. |
Q.38 | The table shows a list of analysis goals (i, ii, iii) and different statistical tests (P, Q, R). Match the analysis goal to the most appropriate statistical test. Match the analysis goal to the most appropriate statistical test. |
(A) | (i)-(P), (ii)-(R), (iii)-(Q) |
(B) | (i)-(Q), (ii)-(P), (iii)-(R) |
(C) | (i)-(Q), (ii)-(R), (iii)-(P) |
(D) | (i)-(R), (ii)-(Q), (iii)-(P) |
Q.39 | Shifting cultivation is a form of agricultural practice in the hills of Northeast India, where a forest patch is cleared and cultivated for a few years, after which it is left fallow and allowed to regenerate. Succession occurs on such previously cultivated plots. Over time, the plant community should move towards which region in the graph? |
(A) | P |
(B) | Q |
(C) | R |
(D) | S |
Q.40 | Consider 1000 terrestrial species that have geographical ranges of different shapes and sizes. If the Earth were entirely covered by land (no oceans), and the ranges of these species were overlaid on the surface of the Earth at random, which one of the following patterns is expected? |
| (A) | Highest species richness per unit area in the tropics |
| (B) | Highest species richness per unit area at higher latitudes |
| (C) | Roughly equal species richness per unit area at all latitudes |
| (D) | Geographically restricted species found only near the poles |
| Q.41 | The graph below shows how the lower limits of the elevational ranges of bird species on a tropical mountain have changed over 20 years (2000 to 2020) because of climate change. Each point below represents a bird species. Points would cluster on the dashed line if species had the same lower elevational range limits in 2000 and 2020. Given that the mountain summit is at an elevation of 3500 m (solid horizontal line), and assuming that the trend shown by the graph continues over the next 20 years, what would you expect in 2040?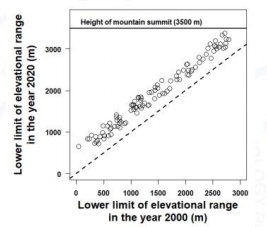 |
| (A) | Low-elevation species will become locally extinct. |
| (B) | Mid-elevation species will become locally extinct. |
| (C) | High-elevation species will become locally extinct. |
| (D) | All species will return to their original elevational ranges. |
Q.42 | Behavioural ecologists exploring a newly discovered island find 20 new species of terrestrial lizards. Males of these species have a dorsal ridge that varies in size from large in some species to entirely lacking in others. The scientists hypothesise that dorsal ridges in males evolved by runaway sexual selection stemming from sensory bias in females. Which one of the following would provide the necessary evidence to support this hypothesis? |
(A) | Females of species in which males lack this trait are attracted to males that have a large dorsal ridge artificially attached to them. |
(B) | Males without a ridge are more likely to attract females of all species than males with a ridge. |
(C) | Males with a larger dorsal ridge win more fights and get more mates than males with a smaller ridge. |
(D) | Females of species whose males have a dorsal ridge do not show a preference for this trait. |
| Q.43 | The graph shows the relationship between a variable on the x-axis and genetic diversity on the y-axis. Each point represents a species and the trend line describes the relationship across species. Select the most appropriate variable for the x-axis. Select the most appropriate variable for the x-axis. |
| (A) | Evolutionary age of species |
| (B) | Abundance |
| (C) | Body size |
| (D) | Geographic range |
Q.44 | Hunting is a major source of mortality for large frugivorous birds. These birds disperse the seeds of forest trees and are the primary contributors to forest regeneration. The graphs show the distribution of different age- classes of a frugivore-dispersed tree species at two isolated sites.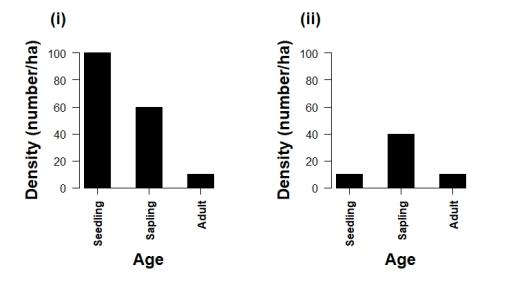 Based on the graphs, select the most likely conclusion. Based on the graphs, select the most likely conclusion. |
(A) | Hunting is higher at site (i) than at site (ii). |
(B) | Hunting is higher at site (ii) than at site (i). |
(C) | Hunting is similar at both sites. |
(D) | Frugivores are not hunted at either site. |
Q.45 | The following phylogeny shows how species P to T are related to each other. The branch lengths indicate the degree of evolutionary change.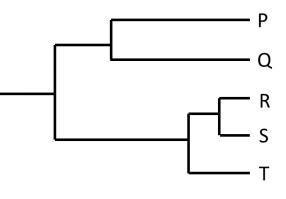 The species composition of three areas is given below Area 1: PQR; Area 2: RST; Area 3: QRSGiven this information, the phylogenetic diversity of The species composition of three areas is given below Area 1: PQR; Area 2: RST; Area 3: QRSGiven this information, the phylogenetic diversity of |
(A) | Area 1 > Area 3 > Area 2 |
(B) | Area 1 = Area 2 = Area 3 |
(C) | Area 1 = Area 3 > Area 2 |
(D) | Area 1 < Area 3 < Area 2 |
Q.46 | The IUCN Red List provides information on the conservation status of different species. Match the species to their status in the table below. | ||
Species | Status | ||
Tiger | Near threatened (NT) | ||
Great Indian Bustard | Extinct (EX) | ||
Passenger Pigeon | Critically endangered (CR) | ||
Blackbuck | Endangered (EN) | ||
(A) | Tiger: NT; Great Indian Bustard: EX; Passenger Pigeon: EN; Blackbuck: CR | ||
(B) | Tiger: EN; Great Indian Bustard: CR; Passenger Pigeon: EX; Blackbuck: NT | ||
(C) | Tiger: EN; Great Indian Bustard: CR; Passenger Pigeon: NT; Blackbuck: EX | ||
(D) | Tiger: NT; Great Indian Bustard: EN; Passenger Pigeon: EX; Blackbuck: CR |
Q.47 – Q.52 Multiple Select Question (MSQ), carry TWO mark each (no negative marks).
Q.47 | A gene duplication event in an organism results in two copies of a gene. Which one (or more) of the following outcomes is/are possible for the duplicated copy? |
(A) | It retains the original function. |
(B) | It acquires a new function. |
(C) | It loses function. |
(D) | It gets translated but not transcribed. |
Q.48 | The egg-laying mammal, platypus, is known for its ability to inject venom by stabbing with spurs on its hindlimbs. Which one (or more) of the following statements supports the hypothesis that venom in this species is used for intrasexual competition? |
(A) | Only males produce venom. |
(B) | Venom is secreted only during the breeding season. |
(C) | Venom is only effective against invertebrates. |
(D) | Venom is ineffective against conspecifics. |
Q.49 | All octopi dream every night, and sometimes change colour while dreaming. A student hypothesises that octopi change colour only when they dream about the food they ate that day. To test this hypothesis, the student conducts an experiment with two treatments that are randomly ordered, and separated by 2 days. In one treatment, she places 10 octopi in individual tanks in captivity and provides each one with a large crab to eat during the day. She then records the dream state colour of these octopi that night. Which one (or more) of the following would be an appropriate NEGATIVE control to test this hypothesis? |
(A) | Provide the same 10 octopi with the same food source (crab), and then record their colour that night when they are dreaming. |
(B) | Provide the same 10 octopi with a new food object (e.g. sea stars) and record the colour that night when they are dreaming. |
(C) | Provide the same 10 octopi with a non-food object (e.g. rock), and record their colour that night when they are dreaming. |
(D) | Provide 10 squid with the same food source (crab) and record the colour that night when they are dreaming. |
Q.50 | Which one (or more) of the following conservation actions would NOT benefit native species? |
(A) | Planting Prosopis juliflora in the Thar desert to reduce erosion. |
(B) | Stringing rope ladders across roads to connect the canopy for facilitating the movement of arboreal animals in the Western Ghats. |
(C) | Increasing lights at night on beaches in Odisha to improve visibility for hatching sea turtles. |
(D) | Growing native species in urban gardens of Bengaluru to attract pollinators. |
Q.51 | In cooperatively breeding animals, offspring from one year stay back and help their parents to rear offspring born in successive breeding episodes. Kin selection has been used to explain such helping behaviour. Which of the following result(s) support(s) the kin selection hypothesis? |
(A) | Helpers provide more care in populations where extra-pair paternity is low, than in populations where extra-pair paternity is high. |
(B) | Individuals who choose to stay and help are more likely to inherit their parents’ territory than individuals who stay but do not help. |
(C) | Individuals who choose to disperse from their natal territory rather than stay and help have a lower survival because of predation during dispersal, when compared with individuals who stay and help. |
(D) | Helpers whose parents continue to form the breeding pair provide more care than helpers whose parents are replaced by a new breeding pair. |
Q.52 | Which one (or more) of the following genetic processes is/are likely to be affected by the disruption of codon usage bias in highly expressed genes? |
(A) | Translation rate |
(B) | Translation accuracy |
(C) | Transcription rate |
(D) | Transcription accuracy |
Q. 53 – Q.55 Numerical Answer Type (NAT), carry TWO mark each (no negative marks).
Q.53 | Male beetles are of two phenotypes: horned and hornless. Horned males mate with twice as many females compared with hornless males. But females mated to hornless males produce one-third more offspring. The reproductive success of a male (number of offspring fathered) is the number of females he mates with multiplied by the number of offspring each female produces. The reproductive success of horned males is_______times that of hornless males. (Round off to one decimal place.) |
Q.54 | A population shows exponential growth of the form |
Q.55 | At a locus with two alleles A1 and A2, the genotype A1A1 produces white flowers, A2A2 produces red flowers, and A1A2 produces pink flowers. For a population in Hardy-Weinberg equilibrium, the frequency of red flowers is 0.25. If the white flowered plants are removed, and all pink and red flowered-plants in this population are randomly crossed amongst each other, the frequency of white flowered plants in the next generation will be______. (Round off to two decimal places.) |
Answer Key
| Q.No. | Ans | Q.No. | Ans | Q.No. | Ans | Q.No. | Ans | Q.No. | Ans | Q.No. | Ans | Q.No. | Ans |
| 1 | C | 1 | A | 11 | D | 21 | A; B | 31 | A | 41 | C | 51 | A; D |
| 2 | C | 2 | B | 12 | A | 22 | A; C | 32 | C | 42 | A | 52 | A; B |
| 3 | D | 3 | A | 13 | B | 23 | 0.99 to 1.01 | 33 | D | 43 | C | 53 | 1.40 to 1.60 |
| 4 | D | 4 | C | 14 | D | 24 | 0.11 to 0.13 | 34 | A | 44 | B | 54 | 6.80 to 7.00 |
| 5 | C | 5 | C | 15 | C | 25 | 0.74 to 0.77 | 35 | C | 45 | A | 55 | 0.10 to 0.12 |
| 6 | D | 6 | C | 16 | A | 26 | C | 36 | A | 46 | B | ||
| 7 | C | 7 | D | 17 | A; C | 27 | C | 37 | C | 47 | A; B; C | ||
| 8 | D | 8 | D | 18 | B | 28 | B | 38 | C | 48 | A; B | ||
| 9 | D | 9 | A | 19 | A; C; D | 29 | B | 39 | B | 49 | C | ||
| 10 | A | 10 | A | 20 | A; C | 30 | C | 40 | C | 50 | A; C |