
![]() Economics
Economics![]()
Section -A
MICRO-ECONOMIC
![]() Q.1. The Total Revenue earned by selling 20 units is ₹ 700. Marginal Revenue earned by selling 21st unit is ₹ 70. The value of Total Revenue earned by selling total 21 units will be (Choose the correct alternative)
Q.1. The Total Revenue earned by selling 20 units is ₹ 700. Marginal Revenue earned by selling 21st unit is ₹ 70. The value of Total Revenue earned by selling total 21 units will be (Choose the correct alternative)
(a) ₹ 721
(b) ₹ 630
(c) ₹ 770
(d) ₹ 720
Answer:(c) ₹ 770
![]() Q.2. In the given figure X1Y1 and X2Y2 are Production Possibility Curves in two different periods T1 and T2 respectively for Good X and Good Y. A1 and A2 represent actual outputs and P1 and P2 represent potential outputs respectively in the two time periods.
Q.2. In the given figure X1Y1 and X2Y2 are Production Possibility Curves in two different periods T1 and T2 respectively for Good X and Good Y. A1 and A2 represent actual outputs and P1 and P2 represent potential outputs respectively in the two time periods.
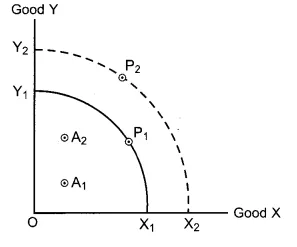
The change in actual output of Goods X and Y over the two periods would be represented by movement from (Fill up the blank)
(a) A2 to P2
(b) A1to P2
(c) P1 to A2
(d) A1 to A2
OR
![]() Q.2. The Marginal Rate of Transformation (MRT) is constant. The Production Possibility Curve, so formed would be ………… to the origin.
Q.2. The Marginal Rate of Transformation (MRT) is constant. The Production Possibility Curve, so formed would be ………… to the origin.
(Fill up the blank)
Answer: (d) A1 to A2
OR
Answer: Straight line
![]() Q.3. Under imperfect competition, Average Revenue (AR) remains ………… Marginal Revenue (MR). (Fill up the blank)
Q.3. Under imperfect competition, Average Revenue (AR) remains ………… Marginal Revenue (MR). (Fill up the blank)
OR
![]() Q.3. For a firm to be in equilibrium, Marginal Revenue (MR) and Marginal Cost (MC) must be …………… and beyond that level of output Marginal Cost must be …………. ” (Fill up the blank)
Q.3. For a firm to be in equilibrium, Marginal Revenue (MR) and Marginal Cost (MC) must be …………… and beyond that level of output Marginal Cost must be …………. ” (Fill up the blank)
Answer: Greater than
OR
Answer: Equal, rising
![]() Q.4. If the supply curve is a straight line parallel to the vertical axis (Y-axis), supply of the good is called as ……………. (Fill up the blank)
Q.4. If the supply curve is a straight line parallel to the vertical axis (Y-axis), supply of the good is called as ……………. (Fill up the blank)
(a) Unitary Elastic Supply
(b) Perfectly Elastic Supply
(c) Perfectly Inelastic Supply
(d) Perfectly Elastic Demand
Answer: (c) Perfectly Inelastic Supply
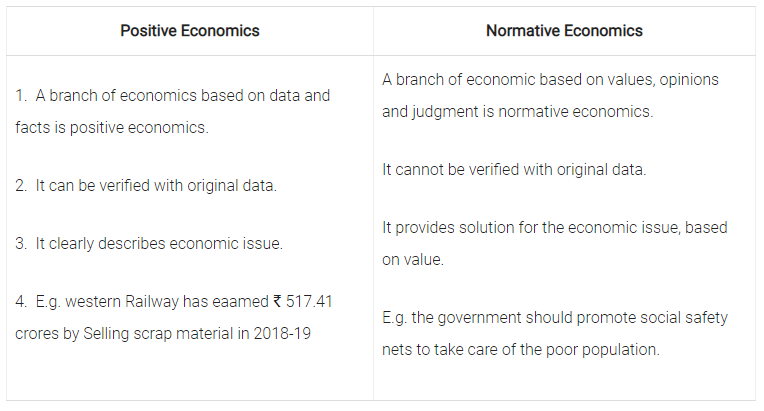
![]() Q.5. Distinguish between positive economics and normative economics, with suitable examples.
Q.5. Distinguish between positive economics and normative economics, with suitable examples.
Answer:
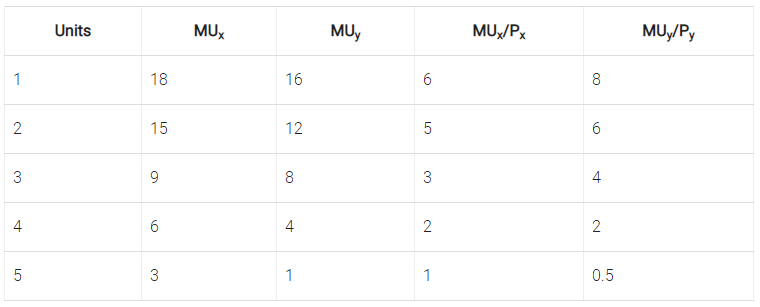
![]() Q.6. Explain the law of diminishing marginal utility, with the help of a hypothetical schedule.
Q.6. Explain the law of diminishing marginal utility, with the help of a hypothetical schedule.
OR
![]() Q.6. Elaborate the law of demand, with the help of a hypothetical schedule.
Q.6. Elaborate the law of demand, with the help of a hypothetical schedule.
Answer: According to the law of diminishing utility, as more and more units of commodity are consumed, the extra utility that we derive from it goes on declining. Total utility will continue to rise till the point of consumption when the marginal utility becomes zero. After this point, MU becomes negative which means now the good begins to harm consumers.
Assumption of Law of Diminishing Marginal Utility
- Utility can be measured in numeric terms.
- The consumption takes place in the stipulated time period (in continuation).
- All the consumers are assumed to be rational.
- Marginal utility of rupee is assumed to be constant.

The schedule indicates that as more and more units of commodity are consumed, the marginal utility derived from the consumption of each additional unit of the commodity tends to fall. With the consumption of successive units the marginal utility becomes zero and consequently become negative. The MU become zero at the consumption of 4th unit and become negative at the consumption of 5th unit.
OR
Answer: The law of demand explains the inverse relationship between price and quantity demanded of a commodity. According to this law, ‘other things remaining constant’ (ceteris paribus), price and quantity demanded of a commodity move in the opposite direction. When the price of the commodity increases, the quantity demanded falls and when the price decreases, the quantity demanded increases, provided factors other than price remain constant. More units of a commodity are purchased at a lower price because of a substitution effect and income effect.
Following are the assumptions of law of demand :
(a) No change in consumer’s income.
(b) No change in the price of related goods.
(c) No change in the consumer’s taste, preferences and fashion.
(d) No expectation of change in the future prices of the goods.
(e) No change in the population.
Demand schedule
| Price of Sugar (₹ per kg) | 20 | 40 | 50 | 70 |
| Quantity | 100 | 75 | 60 | 40 |
The demand schedule shows that the consumer will demand more sugar at a lower price, other things being constant. When the price of sugar is ₹ 20 per kg the quantity demanded will be 100 kg but when price increase to ₹ 40 the demand decreases to 75 kg and 50 Kg so on. This shows that the price and demand are inversely related
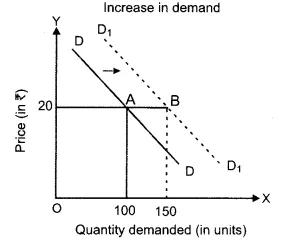
![]() Q.7. The market for a good is in equilibrium. How would an increase in an input price affect the equilibrium price and equilibrium quantity, keeping other factors constant ? Explain using a diagram.
Q.7. The market for a good is in equilibrium. How would an increase in an input price affect the equilibrium price and equilibrium quantity, keeping other factors constant ? Explain using a diagram.
Answer: Input price refers to the money paid to the factors of production in return for their productive services. As the input price rises, the cost of production also rises and produc-tion levels falls. This leads to a leftward shift in the supply curve.
This leads to excess demand in the market. It leads to competition among buyers. Due to this, the price starts rising. As the price rises, demand contracts and supply expands. This will continue until there is no more excess demand.
Finally equilibrium prices rises from P1 to P2 and equilibrium quantity falls from Q1 to Q2.

![]() Q.8. (a) The coefficient of price elasticity of demand for Good X is (-) 0-2 . If there is a 5% increase in the price of the good, by what percentage will the quantity demanded for the good fall?
Q.8. (a) The coefficient of price elasticity of demand for Good X is (-) 0-2 . If there is a 5% increase in the price of the good, by what percentage will the quantity demanded for the good fall?
(b) Arrange the following coefficient of price elasticity of demand in ascending order : (-) 3.1, (-) 0.2, (-) 1.1
OR
![]() Q.8. How would the demand for a commodity be affected by a change in “tastes and preferences” of the consumers in favour of the commodity? Explain using a diagram. Answer: (a)
Q.8. How would the demand for a commodity be affected by a change in “tastes and preferences” of the consumers in favour of the commodity? Explain using a diagram. Answer: (a)

Percentage change in Quantity demanded = -1% Elasticity of demand is unitary elastic and the percentage fall in quantity demanded is 1%.
(b) Ascending order (-) 0.2, (-)1.1, (-)3.1.
OR
Answer: Taste and preference is one of the factors affecting individual demand. If the consumers in the market have started liking a particular commodity, the demand for that commodity will increase. On the other hand, if there is a disliking for a particular commodity or preference for a commodity is falling, demand will decrease.
So change in taste and preference of the commodity in favour of the other commodity, will shift the demand curve towards right from DD to D1 D1.
![]() Q.9. Which of the following statements are true or false ? Give valid reasons in support of your answer. ‘
Q.9. Which of the following statements are true or false ? Give valid reasons in support of your answer. ‘
(a) Average cost curve cuts Average variable cost curve at its minimum level.
(b) Average product curve and Marginal product curve are ‘U-shaped’ curves.
(c) Under all market conditions, Average revenue and Marginal revenue are equal to each other.
(d) Total cost and Total variable cost curve are parallel curve to each other.
OR
![]() Q.9. Explain a firm’s equilibrium under perfect competition, using a hypothetical schedule.
Q.9. Explain a firm’s equilibrium under perfect competition, using a hypothetical schedule.
Answer: (a) False-Average cost and Average variable cost curves are U shaped curve. The vertical gap between Average cost Average variable cost curves represent Average fixed cost. As we know with the increase in the output the vertical gap between Average cost Average variable cost curves continuously decrease but never intersect.
(b) False, Average product curve and marginal product curve both rises and then tend to fall. Thus, the two curves are inverted ‘U’ shaped curve.
(c) False, only under perfect competition, AR and MR are equal to each other. Under Monopoly and monopolistic market, AR is greater than MR.
(d) True, TC and TVC curves are parallel to each other because the vertical distance between the two curves is TFC which is constant at all levels of output.
OR
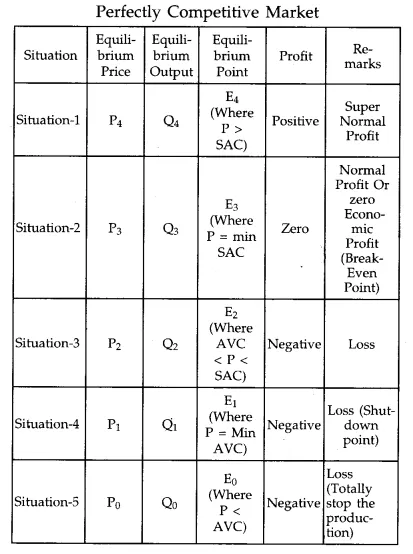
Answer: In a perfectly competitive market, a very large number of firms produce a homogeneous (or identical) product and sell it to a very large number of buyers at a fixed price. Not a single buyer or seller can influence the market price. They are price taker. There is free entry or exit of firms in this form of market. Of course, en-try can take place only in the long-run. Here we assume that all firms in the industry are working under identical cost conditions. Iden-tical cost conditions for the firms mean that Average Cost (AC) and Marginal Cost (MC) curves are identical for all firms in the in-dustry. In economics, short-run refers to that time period in which a firm can’t alter its fixed factors and the size of the plant. The firm can change its output by changing variable factors of production. Both in the short-run and long- run, firm’s objective is to maximize profit. The profit is given by the difference between Total Revenue (TR) and Total Cost (TC) i.e. profit = TR – TC. Now, profit maximising output quan-tity is reached when two conditions are satis-fied.
(a) MR = MC
(b) Rate of change in MR < Rate of change in MC
In a perfectly competitive market P = AR = MR = constant. So, the profit maximising condition in a perfectly competitive market boil down to
(a) P = MC (or SMC)
(b) MC (or SMC) curve must be positively sloped
This can be clear with the help of a table given below :
Five Situations of Short-Run Equilibrium under
![]() Q.10. Explain the meaning of the following features of the Oligopoly Market :
Q.10. Explain the meaning of the following features of the Oligopoly Market :
(a) Non-Price Competition
(b) Few Sellers
Answer: (a) Non-price Competition: Oligopoly firm not only competes through price but also on the basis of non-price competition. Product variation and advertisement are the two main forms of non price competition as they fear price war. Normally, the oligopoly firms do not respond to a rise in price by the rivals. However/they have to respond if a rival firm reduces the price of the product.
Implication : This results in price rigidity in the market.
(b) Few Sellers: Under Oligopoly, there are only a few firms, producing a commodity. The product can be homogeneous or differentiated. These firms can influence the price and output by their actions.
Each firm produces significant portion of total output. There exists competition among different firms and each firm try to manipulate both price and volume of production. The number of buyers are large.
Implications: The number of firms is so small that an action by any firm is likely to affect the other firm. So every firm keeps a close watch on the actions of each other.
![]() Q.11. (a) What is meant by increasing returns to a variable factor?
Q.11. (a) What is meant by increasing returns to a variable factor?
(b) Discuss briefly, any two reasons for the decreasing returns to a variable factor.
Answer:
(a) In short period, when other factors of production remains constant, if the proportionate change in Total Product is greater than the proportionate change in units of variable factor. If marginal product increases with the increase in units of a variable factors, then it is known as the law of increasing returns to a variable factor.
(b) Causes of Decreasing Returns to Variable Factor :
(i) Decrease in the level of efficiency : If we increase the units of variable factors too much with fixed factors of production (after optimum combination), then the factor proportion becomes more and more worse. Due to that, the efficiency of both the factors decreases (because we are moving away from ideal combination). That’s why AP and MP both decrease. Due to that AC and MC both increases.
(ii) Imperfect substitute : At the point of optimum combination of means of production average and marginal productivity can be increased by substituting fixed factor (because at this point fixed factor is completely utilized). But the factors of production are not perfect substitutes, therefore it is not possible to replace fixed factor with other factors and that’s why, if we have to increase the output at optimum combination then we have to increase the units of variable factor with the same units of fixed factors. As a result there will be over utilization of fixed factor, so AP and MP both decreases and AC and MC both increases. So ultimately decreasing return will apply.
![]() Q.12. Explain the following conditions :
Q.12. Explain the following conditions :
(a) Movement along the same indifference curve.
(b) Shift from a lower to a higher indifference curve.
OR
![]() Q.12. Explain the law of Equi-Marginal Utility.
Q.12. Explain the law of Equi-Marginal Utility.
Answer: (a) Movement along the same indifference curve : All the points along with the same indifference curve represents all those combinations of two commodities which provides the same level of satisfaction to the consumer. Level of satisfaction remains constant whether we move upward or downward along the same indifference curve. In order to increase the consumption of one commodity the consumer has to sacrifice the consumption of the other “and he moves up and down on the same indifference curve.

In the present diagram, combination A (OX + OY) provides the satisfaction equal to combination B (OX1 + OY1).
(b) Shift from lower to a higher indifference curve : Curves nearer to origin represent lower level of satisfaction and curves which are away from origin represent higher level of satisfaction. It means as we move away from origin, level of satisfaction continuously increases.

In the present diagram IC2 represent higher level of satisfaction in comparison to IC1 and in the same way IC3 represent satisfaction more than IC1 and IC2 .
So if there are three indifferent curves in a single diagram then they will represent three different levels of satisfaction.
OR
Answer: Law of Equi-marginal utility states that a consumer allocates his expenditure on various commodities in such a manner that the utility derived from each additional unit of the rupee spent on each of the commodities is equal.
The ratio of the MU to price of X must be equal to the ratio of MU and price of Y.
MUx/Px = MUy/Py…………… = MUn/Pn
This is known as a law of equi-marginal utility. It means the equality of the MU of the last rupee spent on each good. If Mux /Px is greater than My/Py, it means that MU from the last rupee spent on good X is greater than MU of the last rupee spent on good Y. This induces the consumer to transfer the expenditure from Y to X. The consumption of X rises and MUx falls, and MU of Y rises. This act continues till MUx/Px and MUy/Py are equal.
Assumptions of Law of Equi Marginal Utility
1. Utility can be measured in numeric terms.
2. The consumption takes place in the stipulated time period (in continuation).
3. All the consumers are assumed to be rational.
4. Marginal utility of rupee is assumed to be constant.
For e.g.: A consumer consumers 2 commodities X and Y for ₹ 3/unit and ₹ 2/unit respectively. It is assumed that MUR = ₹ 2
Section -B
MACRO-ECONOMICS
![]() Q.13. Primary deficit in a government budget will be zero, when ………….. (Choose the correct alternative).
Q.13. Primary deficit in a government budget will be zero, when ………….. (Choose the correct alternative).
(a) Revenue deficit is zero
(b) Net interest payments are zero
(c) Fiscal deficit is zero
(d) Fiscal deficit is equal to interest payment.
Answer:
(d) Fiscal deficit is equal to interest payment.
![]() Q.14. In order to encourage investment in the economy, the Central Bank may …………… (Choose the correct alternative).
Q.14. In order to encourage investment in the economy, the Central Bank may …………… (Choose the correct alternative).
(a) Reduce Cash Reserve Ratio
(b) Increase Cash Reserve Ratio
(c) Sell Government securities in open market
(d) Increase Bank Rate
Answer: (a) Reduce Cash Reserve ratio.
![]() Q.15. What do you mean by a direct tax?
Q.15. What do you mean by a direct tax?
OR
![]() Q.15. What do you mean by an indirect tax?
Q.15. What do you mean by an indirect tax?
Answer: Direct tax refers to a compulsory payment to the government whose impact and incidence falls on the same person. It is progressive in nature. Example-Income tax and Property tax.
OR
Answer: Indirect tax refers to a compulsory payment to the government whose impact and incidence falls on different persons. It is regressive in nature. Example- VAT, custom duty.
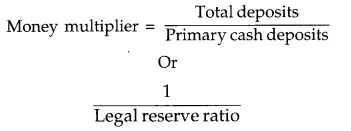
![]() Q.16. Define ‘money multiplier’.
Q.16. Define ‘money multiplier’.
Answer: When the primary cash deposits in the banking system leads to multiple expansion in the total deposits, it is called as money multiplier. It is inversely related to legal reserve ratio.
![]() Q.17. Calculate change in final income, if the Marginal Propensity to Consume (MPC) is 0 8 and change in initial investment is ₹ 1,000 crores.
Q.17. Calculate change in final income, if the Marginal Propensity to Consume (MPC) is 0 8 and change in initial investment is ₹ 1,000 crores.
Answer: MPC = 0.8 and change in initial investment = ₹ 1000 crores
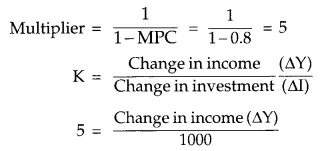
Change in income = ₹ 5000 crores.
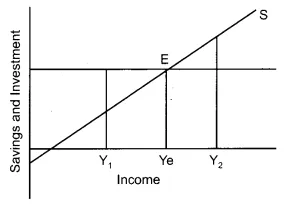
![]() Q.18. State the impact of “Excess Demand” under the Keynesian theory on employment, in an economy.
Q.18. State the impact of “Excess Demand” under the Keynesian theory on employment, in an economy.
OR
![]() Q.18. State the meaning of the following :
Q.18. State the meaning of the following :
(a) Ex-Ante Savings
(b) Full Employment
(c) Autonomous Consumption
Answer: Excess demand is not a desired situation because it does not lead to any increase in the level of aggregate supply as the economy is already working at full employment level. Excess demand has the following effect on output, employment and general price level.
(i) Effect on Output: Excess demand does not affect the level of output because the economy is already working at full employment level and there is no ideal capacity in the economy.
(ii) Effect on Employment : There will be no change in the level of employment as the economy is already operating at full employment equilibrium and there is no involuntary unemployment.
(iii) Effect on General Price Level : Excess demand leads to a rise in the general price level (known as inflation) as aggregate demand is more than aggregate supply.
OR
Answer: (a) Ex-ante saving : The saving which the firms or entrepreneur desire to make at different levels of income in an economy during a period is called ex-ante (planned savings).
(b) Full employment : Full employment refers to the situation when all the workers who are willing and able to work at prevailing wage rate are actually employed and there is no involuntary unemployment
(c) Autonomous consumption : When income is zero consumption is not zero because consumption can never be zero even at zero level of income, there are some basic needs which need to be fulfilled even at zero level of income and to fulfill those basic needs we use past savings. This consumption at zero level of income is termed as ‘Autonomous consumption’ and is denoted as C .
![]() Q.19. Classify the following statement as revenue receipts or capital receipts. Give valid reasons in support of your answer.
Q.19. Classify the following statement as revenue receipts or capital receipts. Give valid reasons in support of your answer.
(a) Financial help from a multinational corporation for victims in a food affected area.
(b) Sale of shares of a Public Sector Undertaking (PSU) to a private company, Y Ltd.
(c) Dividends paid to the Government by the State Bank of India.
(d) Borrowings from International Monetary Fund (IMF).
Answer: (a) Financial help from a multinational company is an aid to the government so it is a revenue receipt as it does not create any liability and reduction in assets.
(b) It is a capital receipt. As sale of shares will reduce the assets of the PSU.
(c) Dividends paid to the government is a revenue receipt as it neither creates any liability nor reduces the assets.
(d) It is a capital receipt. It increases the liability of the government.
![]() Q.20. “Higher Gross Domestic Product (GDP) means greater per capita availability of goods in the economy.” Do you agree with the given statement? Give valid reason in support of your answer.
Q.20. “Higher Gross Domestic Product (GDP) means greater per capita availability of goods in the economy.” Do you agree with the given statement? Give valid reason in support of your answer.
OR
![]() Q.20. Explain the meaning of Real Gross Domestic Product and Nominal Gross Domestic Product, using a numerical example.
Q.20. Explain the meaning of Real Gross Domestic Product and Nominal Gross Domestic Product, using a numerical example.
Answer: I do not agree with the statement that “Higher gross domestic product (GDP) means greater per capita availability of goods in the economy” as higher GDP does not mean high per head availability of goods and services.
(i) It depends upon the population of the country. If GDP is higher but population is • equally high then per head availability of goods and services will be low.
(ii) It also depends on the fact that whether the income is equally distributed or unequally distributed. If income is equally distributed then share of goods and services for each individual will be equal but if it is unequally distributed, the rich will take more share in comparison to a poor.
OR
Answer: Real GDP refers to the money value of all final goods and services calculated at a base year price produced within the domestic territory in a given time period.
Nominal GDP refers to the money value of all final goods and services calculated at a current year prices produced within the domestic territory in a given time period.
| Commodities | Quantity in 2018 | Prices in 2011 | Prices in 2018 | Real GDP | Nominal GDP |
| A | TO | 5 | 10 | 50 | 100 |
| B | 15 | 7 | 10 | 105 | 150 |
| C | 20 | 10 | 15 | 200 | 300 |
| D | 5 | 12 | 15 | 60 | 75 |
| Total | ——— | ——— | ——– | 415 | 725 |
In the above table real GDP is ₹ 415 for the year 2018 while nominal GDP is ₹ 725 for the same year. Such a difference in GDP is due to increase in prices from base year to current year.
Therefore, Real GDP is always considered as true indicator of economic growth.
![]() Q.21. Distinguish between ‘Qualitative and Quantitative tools’ of credit control as may be used by a Central Bank.
Q.21. Distinguish between ‘Qualitative and Quantitative tools’ of credit control as may be used by a Central Bank.
Answer:

![]() Q.22. (a) Define “Trade Surplus” and “Trade Deficit”.
Q.22. (a) Define “Trade Surplus” and “Trade Deficit”.
(b) Discuss briefly the concept of managed floating system of foreign exchange rate determination.
Answer: (a) Trade surplus refers to the excess of exports of goods over the imports of goods. Trade deficit refers to the excess of import of goods over the export of goods.
(b) Managed floating exchange rate system- It is a system in which the foreign exchange rate is determined by the market forces and central bank influences the exchange rate through intervention in the foreign exchange market. Central bank interferes to restrict the fluctuations in the exchange rate within limits. For this central bank maintains the reserve of foreign exchange to ensure that the exchange rate stays within the targeted value. It is also known as “Dirty floating”.
![]() Q.23. Discuss the adjustment mechanism in the following situations :
Q.23. Discuss the adjustment mechanism in the following situations :
(a) Aggregate demand is lesser than Aggregate Supply.
(b) Ex-Ante Investments are greater than Ex- Ante Savings.
Answer: (a) At the income level above the equilibrium, the planned aggregate demand (AD) is less than the aggregate supply (AS). This implies that there is an excess availability of goods and services in an economy. This surplus in goods is added to the inventory stock of goods. The rise in the inventories above a desired level reduces the production which leads to the decrease in income and employment in the economy. This process continues till AD gets equal to AS.

(b) Adjustment Mechanism when planned in-vestment is greater than planned savings :
(i) When planned (ex-ante) saving is greater than planned investment. Suppose firms plan to invest ₹ 20,000 crores but households plan to save ₹ 25,000 crores, it shows consumption expenditure has decreased. Consequently, AD falls short of AS. Due to excess supply there will be stockpiling of unsold goods, i.e., unintended unplanned inventories will accumulate. At this, the producers will cut down employment and produce less. National income will fall and as a result planned saving will start falling until it becomes equal to planned investment. It is at this point equilibrium level of income is determined.
(ii) When planned (ex-ante) saving is less than planned investment. Suppose producers plan to invest ₹ 20,000 crores but households plan to save ₹ 15,000 crores, then AD (or consumption expenditure) is more than AS. Production will have to be increased to meet the excess demand. Consequently national income will increase leading to rise in saving until saving becomes equal to investment. It is here that equilibrium level of income is established because what the savers intend to save becomes equal to what the investors intend to invest. If planned saving and planned investment are equal, then output, income, employment and the price level will be constant.
![]() Q.24. Define the following :
Q.24. Define the following :
(a) Value Addition
(b) Gross Domestic Product
(c) Flow Variables
(d) Income property and entrepreneurship
OR
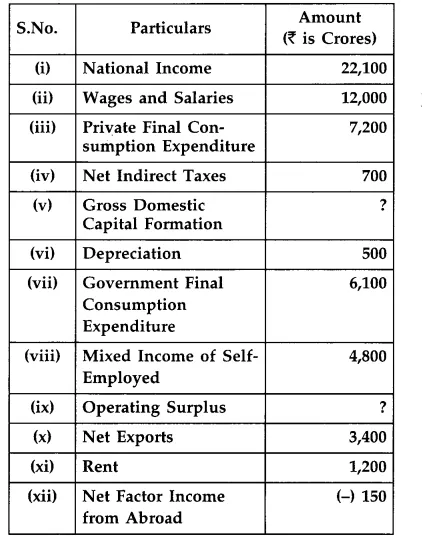
![]() Q.24. Given the Following data, find the value of “Gross Domestic Capital Formation” and “Operating Surplus”.
Q.24. Given the Following data, find the value of “Gross Domestic Capital Formation” and “Operating Surplus”.
Answer: (a) Value addition refers to the produced within the domestic territory of a country during an accounting year.
(b) Gross domestic product refers to the money value of all final goods and services produced within the domestic territory of the country during an accounting year.
(c) Flow variables are measurable variables that are measured over a period of time, e.g., National income.
(d) Income from property and entrepreneurship is also called the operating surplus which is the sum up of rent, royalties, interest and profits.
OR
Answer: Gross Domestic Capital Formation = (i) – {(iii) + vii + x} + vi – xii + iv
GDCF = 22,100 – {7,200 + 6,100 + 3,400} + 500 (-150) + 700
GDCF = ₹ 6750 crores
Operating Surplus = National income – wages and Salaries – mixed income of self employed – net factor income from abroad
= 22,100 – 12,000 – 4,800 – (-150)
= ₹ 5,450 crores